|
SAS Visual Modeling certification questions and exam summary helps you to get focused on the exam. This guide also helps you to be on A00-274 exam track to get certified with good score in the final exam. SAS Visual Modeling (A00-274) Certification Summary
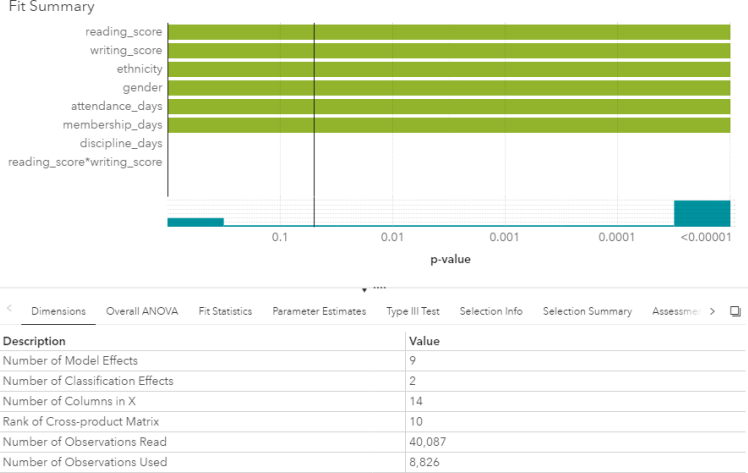
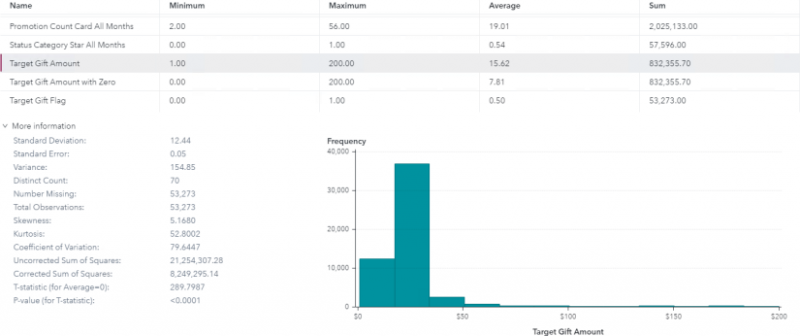
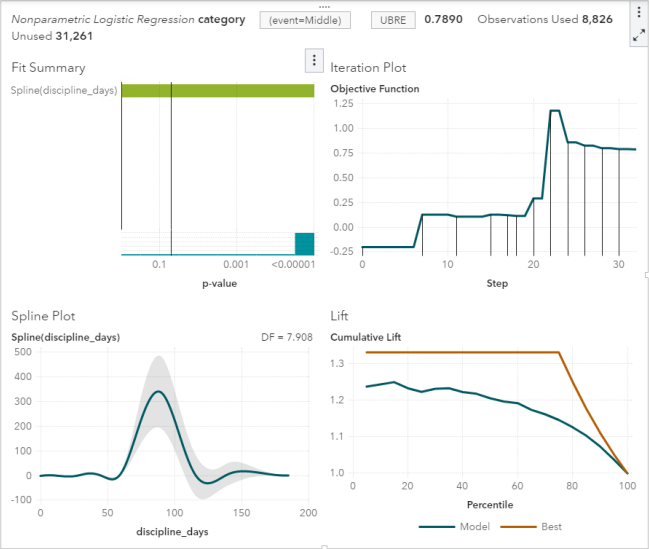
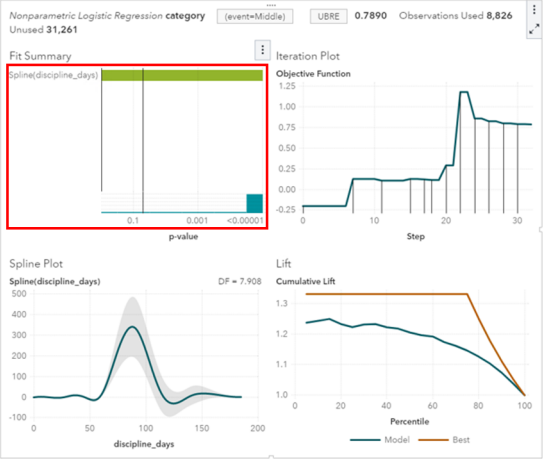
SAS Visual Modeling (A00-274) Certification Exam Syllabus 01. SAS® Visual Statistics Cross-functional Tasks - 18% Prepare data using SAS® Visual Analytics. - Manage explorations and visualizations. - Impute a variable. - Transform a variable. - Create an aggregated measure. - Replace dirty data with missing values. - Combine multiple categories into fewer levels. - Create dummy variables in SAS® Visual Analytics and SAS® Visual Data Builder. Filter data used for a model. - Exclude selections to filter data. - Apply filters to visualization and data source. - Review Measure Details. Use interactive group-by. - Explain group-by modeling. - Assign a group-by variable to a predictive model (logistic regression, linear regression model and generalized linear model). - Interactively examine the Fit Summary for group-by models. - Choose the best fitting group-by model using fit statistics and Variable Importance. - Interpret model results using advanced group-by feature. - Examine the summary table for group-by processing. 02. Building and Assessing Segmentation Models - 32% Perform unsupervised segmentation using cluster analysis. - Explain unsupervised classification. - Given a scenario, set proper inputs for k-means algorithm. - Build a cluster analysis in SAS® Visual Statistics. - Assign roles for cluster analysis. - View and edit cluster properties. - Set Parallel Coordinate properties for a cluster. - Given a scenario, appropriately change the number of clusters. - Derive a cluster ID variable and use it in another visualization. Analyze cluster results. - Interpret a Cluster Matrix. - Interpret Parallel Coordinates plot. - Interpret Cluster Summary tab. Perform supervised segmentation using decision trees. - Explain how split points are determined. - Assign variable roles for a decision tree. - Define decision tree properties. - Describe how predictions are formulated for a decision tree. - Explain variable selection methods for decision trees. - Derive a leaf ID for use in other models. - Prune a decision tree. Asses decision tree results. - Interpret tree with Tree Map. - Interpret Leaf statistics. - Interpret Assessment panel. - Investigate leaf nodes. - Explain icicle plot. 03. Building and Assessing Regression-type Models - 40% Explain linear models. - Explain linear regression. - Model effects usage. - Given a scenario, determine when to use a linear regression model vs. a generalized linear model. Perform linear regression modeling. - Assign linear regression roles. - Add Interaction Effect. - Define linear regression properties. - Explain informative missingness. - Review outlier details and exclude outliers. Perform generalized linear regression modeling. - Assign generalized linear model roles. - Assign offset variable. - Define linear regression properties. - Link functions and distributions in generalized linear models. - Given a scenario, choose appropriate distribution and link function. Perform logistic regression modeling. - Explain logistic regression essentials. - Explain prediction in logistic regression. - Explain variable selection in SAS® Visual Statistics. - Specify which variable is the event (binary). - Specify how a multinomial response variable is used in SAS® Visual Statistics. - Assign logistic regression roles. - Define logistic regression properties. - Specify when to use appropriate link function when building a predictive model. Assess model results. - Interpret Fit Summary window. - Interpret Residual Plot. - Interpret ROC chart (KS Statistic). - Evaluate Misclassification plot. - Evaluate the Lift chart. - Interpret Influence plot. - Interpret Summary bar. - Assess residuals and other model diagnostics to choose an appropriate distribution and link function. - Derive predicted values and describe in terms of predicted probabilities in SAS® Visual Statistics. - Apply prediction cut-off. 04. Model Comparison and Scoring - 10% Compare models - Explain model comparison features. - Assign model comparison properties. - Interpret comparison results using Assessment panel, Fit Statistics, ROC charts, concordance statistics, misclassification, etc. - Interpret Summary Table for model comparison (statistics, variable importance). - Given a scenario, use a particular fit statistic to select a champion model. - Define the conditions that make models comparable in SAS® Visual Statistics. Score models - Explain scoring functionality. - Export score code. - Implement score code. - Identify which SAS® tools can score new data using score code generated by SAS® Visual Statistics. SAS Visual Modeling (A00-274) Certification Questions 01. You would like to compare multiple models that you've built in SAS Visual Statistics. Which parameters must be the same for all models being compared? (choose 3) a) Data Source b) Assessment Bins c) Model Type d) Event Level e) Response Variable f) Link Function 02. Your company has a dataset that represents global sales. You are a part of a team of analysts that each have responsibility for a certain region of the world. You decide to create a data source filter to suppress every region but yours. What effect will this have on any new explorations that your teammates create? a) It will delete all observations that do not match your region. b) It will have no effect on any observations in the dataset. c) It will suppress all observations that do not match your region. d) It will suppress all observations that do not match their corresponding region. 03. Which equation does NOT represent a linear model? Note: bi are parameters and Xi are variables. a) y = b0 + b1X1 + b2X2 b) y = b0 + b1X1 + b2X2 + b3(X1X2) c) y = b0 + b1X1 + (b2/b1)X2 d) y = b0 + b1X1 + b2X1 3 04. You perform a logistic regression on a multinomial response variable in SAS Visual Statistics that has 3 levels: Small, Medium, Large. "Large" is specified as the event. Which statement is true? a) The other levels are grouped into one non-event. b) An ordinal logistic regression is performed. c) A multinomial logistic regression is performed. d) The other levels are offset to account for exposure. 05. Refer to the exhibit from a linear regression model in SAS Visual Statistics. Based on the table above and assuming a significance level of 0.05, what can be concluded about the linear regression model? a) The Intercept is an important predictor of the response. b) RestPulse is a significant predictor of the response. c) For one one-unit increase in RunTime, there is an expected increase in the response of 2.6287. d) For a .03696 unit decrease in RunPulse, there is an expected one-unit increase in the response. 06. Refer to the exhibit: Which option was not specified in creating the linear regression model using SAS Visual Statistics? a) interaction term b) group-by variable c) variable selection d) continuous effects 07. Refer to the exhibit: Which is the modeling approach that should be used when fitting the Target Gift Amount variable? a) Linear regression model with Interaction effects. b) Generalized linear model with a Poisson distribution and Identity link. c) Generalized linear model with a Normal distribution and Log Link. d) Logistic regression model. 08. In the below nonparametric logistic regression results display, where would you click to get a plot of significant continuous effects? Solution: Determine whether the given solution is correct?
a) Correct b) Incorrect 09. Which statement is TRUE regarding a generalized additive model (GAM) in SAS Visual Analytics? a) GAM assumes a strict linear relationship between the predictors and the response function. b) The roughness penalty controls the balance between goodness of fit and the roughness of the spline curve. c) Specification of a spline effect is optional. d) A larger maximum degrees of freedom for the univariate spline term enforces a less complex fit. 10. Which model does not produce score code? a) Decision Tree using interactive mode b) Regression using interaction effects c) Regression using the group by option d) Decision Tree using the rapid growth option Answers: Question: 01: Answer: a, d, e Question: 02: Answer: b Question: 03: Answer: c Question: 04: Answer: a Question: 05: Answer: c Question: 06: Answer: b Question: 07: Answer: c Question: 08: Answer: a Question: 09: Answer: b Question: 10: Answer: a How to Register for SAS Visual Modeling Certification Exam? Visit site for Register SAS Visual Modeling Certification Exam.
0 Comments
Leave a Reply. |
|
